
Support and Resistance
Prices fluctuate due to supply and demand-at times demand is greater than supply thus prices rise and when supply is greater than demand do prices fall. On some occasions, market prices will also tend to move sideways.
Support and resistance are fundamental in market analysis-technical analysis. When practically applied in reading price charts, they produce immense profits. When a trader is doing technical analysis, the use of support and resistance levels identifies points or price levels on a chart where market trend pauses or reverses.
Support and resistance zones utilize entirely price levels based on past market moves, offering information about what may happen to market prices in the future.
A well-drawn support (a zone where there are more buyers than sellers) signifies a reversal in downtrend is expected to happen due to a concentration of demand. While resistance (a zone where there are more sellers than buyers) shows a reversal in uptrend is expected to happen due to a concentration of supply.
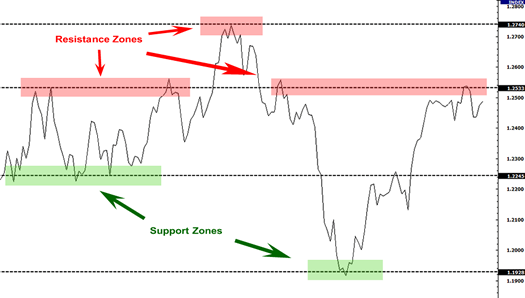
Support and resistance are more effective when drawn in zones on charts coupled with other indicators like trendlines and moving averages.

Looking at the chart above, you can visually see and come to the conclusion that support (bottom box in red) and resistance zones (upmost box in blue) are not actually broken; except the previously support zones (middle box in red) which after being broken became resistance before the market continued in a downward movement.
Anothet way of finding these zones, is to plot support and resistance on a line chart rather than a candlestick chart.
Line charts will only show the closing price while candlesticks show extreme highs and lows which can be misleading because oftentimes, they are just sudden market reactions. A good example is when someone does something out of reflex -like a “knee-jerk” reaction.
When plotting support and resistance plot markets intentional movements. You don’t plot using the reflexes. Just look at the picture below


.webp)


No comments:
Post a Comment